In 2019, high-authority links remain highly correlated with rankings. However, acquiring great links is becoming increasingly difficult. Those of you who operate publications of any variety, especially those who enjoy high domain authority, have likely received several link building requests or offers like this each day:
“Please link to my suspect site that provides little or no value.”
“Please engage in my shady link exchange.”
“I can acquire 5 links of DA 50+ for $250 each.”
Or maybe slightly more effectively:
“This link is broken, perhaps you would like to link here instead.”
“You link to X resource, but my Y resource is actually better.”
This glut of SEOs who build links through these techniques above have been consistently eroding the efficacy of this style of little-to-no-value ad outreach link building. In the past, perhaps it was possible to convert 2% of outreach emails of this style to real links. Now, that number is more like 0.2 percent.
Link building outreach has become glorified email spam—increasingly ignored and decreasingly effective. And yet, high-authority links remain one of the single most important ranking factors.
So where do we go from here?
Let’s start with a few axioms.
The conclusion: Leveraging data journalism to tell newsworthy stories re-enables effective promotion of content via outreach/pitching. Doing so successfully results in the acquisition of high domain authority links that enjoy the potential for viral syndication. Overall data journalism and outreach represents one of the only remaining scaleable high-authority link building strategies.
How can I leverage data journalism techniques to earn coverage?
To answer this question, I conducted my own data journalism project about the state of data journalism-driven link building! (Meta, I know.)
The primary goal was to understand how major publications (the places worth pitching content) talk about data journalism findings from external sources. By understanding how data journalism is covered, we lay the groundwork for understanding what types of data journalism, themes, and strategies for outreach can be most effective for link building.
We pulled 8,400 articles containing the text “study finds.” This keyword was used as a heuristic for finding data-driven news stories created by outside sources (not done internally by the news publication themselves). We then supplemented these articles with additional data, including links built, social shares, and Google’s Machine Learning topic categorization.
The categories derived by Google’s classifier can have multiple tiers based on the keywords in the article titles, giving us four ways to show the results within each category: The main topic area (containing all relevant subcategories), just the first subcategory, just the second subcategory, and just the third subcategory.
Which outlets most frequently cover data-driven stories from external pitches?
Let’s begin by taking a look at which top-tier news outlets cover “study finds” (AKA, any project pitched by an outside source that ran a survey or study that had “findings”). For companies conducting studies, they hope to win press coverage for, these top sites are prime targets, with editorial guidelines that clearly see outside pitches of study findings as attractive.
It’s not surprising to see science-based sites ranking at the top, as they’re inherently more likely to talk about studies than other publications. But sites like The Independent, Daily Mail, The Guardian, CNN, Washington Post, and NBC News all ranked highly as well, providing great insight into which established, trusted news sources are willing to publish external research.
Which topic areas do these publishers write about most?
Diving a little deeper, we can explore which topics are covered in these publications that are associated with these external studies, providing us insight into which verticals might be the best targets for this strategy.
There are many unique insights to be gleaned from the following charts depending on your niche/topical focus. This data can easily be used as a pitching guide, showing you which publishers are the most likely to pick up and cover your pitches for the findings of your study or survey.
Here is a view of the overall category and subcategory distribution for the top publishers.
As you can see, it’s...a lot. To get more actionable breakdowns, we can look at different views of the topical categories. The categories derived by Google’s classifier can have multiple tiers based on the keywords in the article titles, giving us several ways to show the results within each category.
You can explore the Tableau sheets to get into the nitty-gritty, but even with these views, a few more specialized publications, like InsideHigherEd.com and blogs.edweek.org, emerge.
Which topic areas drive the most links?
Press mentions are great, but syndication is where data journalism and content-based outreach strategy really shines. I also wanted to understand which topic areas drive link acquisition. As it turns out, some topics are significantly better at driving links than others.
Note that the color of the bar charts is associated with volume of sharing by topic—the darker the bar on the chart, the higher it was shared. With this additional sharing data, it’s plain to see that while links and social shares are highly correlated, there are some categories that are top link builders but do not perform as well on social and vice versa.
This next set of data visualizations again explore these topic areas in detail. In each batch, we see the median number of links built as an overall category aggregate and then by each category.
Which domains generate the most links when they pick up a data-driven story?
Another interesting question is which domains overall result in the largest number of links generated for “study finds” stories. Below is that ranking, colored by the median number of total shares for that domain.
Notice that while The Independent ranked supreme in the earlier graph about including the most “study finds” pieces, they don’t appear at all on this graph. Sites like The Guardian, CNN, The Washington Post, and NBC News, however, score highly on both, meaning they’re probably more likely to publish your research (relatively speaking, since all high-authority sites are tough to get coverage on), and if you’re successful, you’re probably more likely to get more syndicated links as a result.
Which topic areas are the most evergreen?
Now, let’s look at each category by BuzzSumo’s “evergreen score” to see what kind of content will get you the most bang for your buck.
The evergreen score was developed by BuzzSumo to measure the number of backlinks and social shares an article receives more than a month after it’s published.
When you’re considering doing a study and you want it to have lasting power, brainstorm whether any of these topics tie to your product or service offering, because it appears their impact lingers for longer than a month:
What this all means
Link building through data-driven content marketing and PR is a predictable and scalable way to massively impact domain authority, page authority, and organic visibility.
Always consider:
1. Which publishers make sense to pitch to?
Do they often cover external studies?Do they cover topics that I write about?Does their coverage lead to a high volume of syndicated links?
2. Does my topic have lasting power?
To really make the most of your content and outreach strategy, you’ll need to incorporate these tips and more into your content development and pitching.
These ideas and methodologies are at the heart of the work we do at Fractl and have been instrumental in helping us develop best practices for ideation, content creation, and successful outreach to press. Pulling on each of these levers (and many others), testing, and accumulating data that can then be used to refine processes is what begins to make a real impact on success rates and allows you to break through the noise.
If you want to discuss the major takeaways for your industry, feel free to email me at kristin@frac.tl.
Did anything surprise you in the data? Share your thoughts below!
Sign up for The Moz Top 10, a semimonthly mailer updating you on the top ten hottest pieces of SEO news, tips, and rad links uncovered by the Moz team. Think of it as your exclusive digest of stuff you don't have time to hunt down but want to read!
Popular DNA testing companies like Ancestry and 23andMe can — and frequently do — sell your data to drug makers.
On Wednesday, pharmaceutical giant GlaxoSmithKline announced it was acquiring a $300 million stake in 23andMe — making that connection much more explicit.
If that new has you wondering about how your own genetic material is being used, here's a guide to deleting your DNA sample and data from 23andMe, Ancestry, and Helix.
Popular spit-in-a-tube genetics testing companies like Ancestry and 23andMe can — and frequently do — sell your data to drug makers. But on Wednesday, one of those partnerships became much more explicit: pharmaceutical giant GlaxoSmithKline announced it was acquiring a $300 million stake in 23andMe.
As part of a 4-year deal between the two companies, GlaxoSmithKline will comb 23andMe's genetic data to look for potential new drugs to develop, also referred to as drug targets. It will also use the genetic data to inform how patients are selected for clinical trials.See the rest of the story at Business Insider
Social networks are among the biggest sources of data today, and this means they are an extremely valuable asset for marketers, big data specialists, and even individual users like journalists and other professionals. Harnessing the potential of real-time Twitter data is also useful in many time-sensitive business processes.
In this article, Toptal Freelance Software Engineer Hanee' Medhat explains how you can build a simple Python application to leverage the power of Apache Spark, and then use it to read and process tweets to identify trending hashtags. Read more: toptal.com
Facebook has a data sharing agreement with Chinese telecom giant and cell phone manufacturer Huawei, reports The Washington Post.
For years, US intelligence officials have raised national security concerns about Huawei's ties to the Chinese government.
Facebook officials told The New York Times the arrangement was "controlled from the get-go," and that no data was stored on Huawei servers.
The partnership is reportedly still ongoing, but Facebook began winding down its device partnership program in April.
Facebook has a data sharing agreement with Huawei, a Chinese telecom giant and Android phone manufacturer that has raised national security concerns from US intelligence officials about its alleged ties to the Chinese government, The Washington Post first reported Tuesday.
The deal, which according to The New York Times was brokered sometime before 2010, granted Huawei access to Facebook user data. The company said the data allowed users to access Facebook, sync their address book, and upload photos directly to Facebook — even without a dedicated Facebook app. See the rest of the story at Business Insider
If you’ve been on the Internet at all in the past few months, you’ve probably seen plenty of notices about privacy policy updates from one service or another. As a marketer, a few of those notices have most likely come from Google.
With the General Data Privacy Regulation (GDPR) set to go into effect on May 25th, 2018, many Internet services have been scrambling to get in compliance with the new standards — and Google is no exception. Given the nature of the services Google provides to marketers, GDPR absolutely made some significant changes in how they conduct business. And, in turn, some marketers may have to take steps to make sure their use of Google Analytics is allowable under the new rules. But a lot of marketers aren’t entirely sure what exactly GDPR is, what it means for their jobs, and what they need to do to follow the rules.
What is GDPR?
GDPR is a very broad reform that gives citizens who live in the European Economic Area (EEA) and Switzerland more control over how their personal data is collected and used online. GDPR introduces a lot of new rules and if you’re up for a little light reading, you can check out the full text of the regulation online. But here are a few of the most significant changes:
Companies and other organizations have to be more transparent and clearly state what information they’re collecting, what it will be used for, how they’re collecting it, and if that information will be shared with anyone else. They can also only collect information that is directly relevant for its intended use. If the organization collecting that information later decides to use it for a different purpose, they must get permission again from each individual.GDPR also spells out how that information needs to be given to consumers. That information can no longer be hidden in long privacy policies filled with legal jargon. The information in disclosures needs to be written in plain language and “freely given, specific, informed, and unambiguous.” Individuals also have to take an action which clearly gives their consent to their information being collected. Pre-checked boxes and notices that rely on inaction as a way of giving consent will no longer be allowed. If a user does not agree to have their information collected, you cannot block them from accessing content based on that fact.Consumers also have the right to see what information a company has about them, request that incorrect information be corrected, revoke permission for their data to be saved, and have their data exported so they can switch to another service. If someone decides to revoke their permission, the organization needs to not only remove that information from their systems in a timely manner, they also need to have it removed from anywhere else they’ve shared that information.Organizations must also be able to give proof of the steps they’re taking to be in compliance. This can include keeping records of how people opt in to being on marketing lists and documentation regarding how customer information is being protected.Once an individual’s information has been collected, GDPR sets out requirements for how that information is stored and protected. If a data breach occurs, consumers must be notified within 72 hours. Failing to comply with GDPR can come with some very steep consequences. If a data breach occurs because of non-compliance, a company can be hit with fines as high as €20 million or 4% of the company’s annual global revenue, whichever amount is greater. Do US-based businesses need to worry about GDPR?
Just because a business isn’t based in Europe doesn’t necessarily mean they’re off the hook as far as GDPR goes. If a company is based in the United States (or elsewhere outside the EEA), but conducts business in Europe, collects data about users from Europe, markets themselves in Europe, or has employees who work in Europe, GDPR applies to them, too.
Even if you’re working with a company that only conducts business in a very specific geographic area, you might occasionally get some visitors to your site from people outside of that region. For example, let’s say a pizza restaurant in Detroit publishes a blog post about the history of pizza on their site. It’s a pretty informative post and as a result, it brings in some traffic from pizza enthusiasts outside the Detroit area, including a few visitors from Spain. Would GDPR still apply in that sort of situation?
As long as it’s clear that a company’s goods or services are only available to consumers in the United States (or another country outside the EEA), GDPR does not apply. Going back to the pizza restaurant example, the other content on their site is written in English, emphasizes their Detroit location, and definitely doesn’t make any references to delivery to Spain, so those few page views from Spain wouldn’t be anything to worry about.
However, let’s say another US-based company has a site with the option to view German and French language versions of pages, lets customers pay with Euros, and uses marketing language that refers to European customers. In that situation, GDPR would apply since they are more clearly soliciting business from people in Europe.
Google Analytics & GDPR
If you use Google Analytics, Google is your data processor and since they handle data from people all over the world, they’ve had to take steps to become compliant with GDPR standards. However, you/your company are considered the data controller in this relationship and you will also need to take steps to make sure your Google Analytics account is set up to meet the new requirements.
Google has been rolling out some new features to help make this happen. In Analytics, you will now have the ability to delete the information of individual users if they request it. They’ve also introduced data retention settings which allow you to control how long individual user data is saved before being automatically deleted. Google has set this to be 26 months as the default setting, but if you are working with a US-based company that strictly conducts business in the United States, you can set it to never expire if you want to — at least until data protection laws change here, too. It’s important to note that this only applies to data about individual users and events, so aggregate data about high-level information like page views won’t be impacted by this.
To make sure you’re using Analytics in compliance with GDPR, a good place to start is by auditing all the data you collect to make sure it’s all relevant to its intended purpose and that you aren’t accidentally sending any personally identifiable information (PII) to Google Analytics. Sending PII to Google Analytics was already against its Terms of Service, but very often, it happens by accident when information is pushed through in a page URL. If it turns out you are sending PII to Analytics, you’ll need to talk to your web development team about how to fix it because using filters in Analytics to block it isn’t enough — you need to make sure it’s never sent to Google Analytics in the first place.
PII includes anything that can potentially be used to identify a specific person, either on its own or when combined with another piece of information, like an email address, a home address, a birthdate, a zip code, or an IP address. IP addresses weren’t always considered PII, but GDPR classifies them as an online identifier. Don’t worry, though — you can still get geographical insights about the visitors to your site. All you have to do is turn on IP anonymization and the last portion of an IP address will be replaced with a zero, so you can still get a general idea of where your traffic is coming from, although it will be a little less precise.
If you use Google Tag Manager, IP anonymization is pretty easy. Just open your Google Analytics tag or its settings variable, choose “More Settings,” and select “Fields to Set.” Then, choose “anonymizeip” in the “Field Name” box, enter “true” in the “Value” box,” and save your changes.
If you don’t use GTM, talk to your web development team about editing the Google Analytics code to anonymize IP addresses.
Pseudonymous information like user IDs and transaction IDs are still acceptable under GDPR, but it needs to be protected. User and transaction IDs need to be alphanumeric database identifiers, not written out in plain text.
Also, if you haven’t already done so, don’t forget to take the steps Google has mentioned in some of those emails they’ve sent out. If you’re based outside the EEA and GDPR applies to you, go into your Google Analytics account settings and accept the updated terms of processing. If you’re based in the EEA, the updated terms have already been included in your data processing terms. If GDPR applies to you, you’ll also need to go into your organization settings and provide contact information for your organization.
Privacy policies, forms, & cookie notices
Now that you’ve gone through your data and checked your settings in Google Analytics, you need to update your site’s privacy policy, forms, and cookie notices. If your company has a legal department, it may be best to involve them in this process to make sure you’re fully compliant.
Under GDPR, a site’s privacy policy needs to be clearly written in plain language and answer basic questions like what information is being collected, why it’s being collected, how it’s being collected, who is collecting it, how it will be used, and if it will be shared with anyone else. If your site is likely to be visited by children, this information needs to be written simply enough for a child to be able to understand it.
Forms and cookie notices also need to provide that kind of information. Cookie consent forms with really vague, generic messages like, “We use cookies to give you a better experience and by using this site, you agree to our policy,” are not GDPR compliant.
GDPR & other types of marketing
The impact GDPR will have on marketers isn’t just limited to how you use Google Analytics. If you use some particular types of marketing in the course of your job, you may have to make a few other changes, too.
Referral deals
If you work with a company that does “refer a friend”-type promotions where a customer has to enter information for a friend to receive a discount, GDPR is going to make a difference for you. Giving consent for data to be collected is a key part of GDPR and in these sorts of promotions, the person being referred can’t clearly consent to their information being collected. Under GDPR, it is possible to continue this practice, but it all depends on how that information is being used. If you store the information of the person being referred and use it for marketing purposes, it would be a violation of GDPR standards. However, if you don’t store that information or process it, you’re OK.
Email marketing
If you’re an email marketer and already follow best industry standards by doing things like only sending messages to those who clearly opt in to your list and making it easy for people to unsubscribe, the good news is that you’re probably in pretty good shape. As far as email marketing goes, GDPR is going to have the biggest impact on those who do things that have already been considered sketchy, like buying lists of contacts or not making it clear when someone is signing up to receive emails from you.
Even if you think you’re good to go, it’s still a good time to review your contacts and double check that your European contacts have indeed opted into being on your list and that it was clear what they were signing up for. If any of your contacts don’t have their country listed or you’re not sure how they opted in, you may want to either remove them from your list or put them on a separate segment so they don’t get any messages from you until you can get that figured out. Even if you’re confident your European contacts have opted in, there’s no harm in sending out an email asking them to confirm that they would like to continue receiving messages from you.
Creating a double opt-in process isn’t mandatory, but it would be a good idea since it helps remove any doubt over whether or not a person has agreed to being on your list. While you’re at it, take a look at the forms people use to sign up to be on your list and make sure they’re in line with GDPR standards, with no pre-checked boxes and the fact that they’re agreeing to receive emails from you is very clear.
For example, here’s a non-GDPR compliant email signup option I recently saw on a checkout page. They tell you what they’re planning to send to you, but the fact that it’s a pre-checked box placed underneath the more prominent “Place Order” button makes it very easy for people to unintentionally sign up for emails they might not actually want.
Jimmy Choo, on the other hand, also gives you the chance to sign up for emails while making a purchase, but since the box isn’t pre-checked, it’s good to go under GDPR.
Marketing automation
As is the case with standard email marketing, marketing automation specialists will need to make sure they have clear consent from everyone who has agreed to be part of their lists. Check your European contacts to make sure you know how they’ve opted in. Also review the ways people can opt into your list to make sure it’s clear what, exactly, they’re signing up for so that your existing contacts would be considered valid.
If you use marketing automation to re-engage customers who have been inactive for a while, you may need to get permission to contact them again, depending on how long it has been since they last interacted with you.
Some marketing automation platforms have functionality which will be impacted by GDPR. Lead scoring, for example, is now considered a form of profiling and you will need to get permission from individuals to have their information used in that way. Reverse IP tracking also needs consent.
It’s also important to make sure your marketing automation platform and CRM system are set to sync automatically. If a person on your list unsubscribes and continues receiving emails because of a lapse between the two, you could get in trouble for not being GDPR compliant.
Gated content
A lot of companies use gated content, like free reports, whitepapers, or webinars, as a way to generate leads. The way they see it, the person’s information serves as the price of admission. But since GDPR prohibits blocking access to content if a person doesn’t consent to their information being collected, is gated content effectively useless now?
GDPR doesn’t completely eliminate the possibility of gated content, but there are now higher standards for collecting user information. Basically, if you’re going to have gated content, you need to be able to prove that the information you collect is necessary for you to provide the deliverable. For example, if you were organizing a webinar, you’d be justified in collecting email addresses since attendees need to be sent a link to join in. You’d have a harder time claiming an email address was required for something like a whitepaper since that doesn’t necessarily have to be delivered via email. And of course, as with any other form on a site, forms for gated content need to clearly state all the necessary information about how the information being collected will be used.
If you don’t get a lot of leads from European users anyway, you may want to just block all gated content from European visitors. Another option would be to go ahead and make that information freely available to visitors from Europe.
Google AdWords
If you use Google AdWords to advertise to European residents, Google already required publishers and advertisers to get permission from end users by putting disclaimers on the landing page, but GDPR will be making some changes to these requirements. Google will now be requiring publishers to get clear consent from individuals to have their information collected. Not only does this mean you have to give more information about how a person’s information will be used, you’ll also need to keep records of consent and tell users how they can opt out later on if they want to do so. If a person doesn’t give consent to having their information collected, Google will be making it possible to serve them non-personalized ads.
In the end
GDPR is a significant change and trying to grasp the full scope of its changes is pretty daunting. This is far from being a comprehensive guide, so if you have any questions about how GDPR applies to a particular client you’re working with, it may be best to get in touch with their legal department or team. GDPR will impact some industries more than others, so it’s best to get some input from someone who truly understands the law and how it applies to that specific business.
Sign up for The Moz Top 10, a semimonthly mailer updating you on the top ten hottest pieces of SEO news, tips, and rad links uncovered by the Moz team. Think of it as your exclusive digest of stuff you don't have time to hunt down but want to read!
Google Analytics is a staple for websites, but ol’ reliable just isn’t what she used to be.
Most – if not all – businesses depend on it on some regular basis to understand how their websites are doing. Is traffic up today? How many visitors are bouncing?
It’s popular, handy, filled with data, and free to use --but today’s websites require more insight than just what Google Analytics can muster.
As great as the platform is for businesses, it’s just not enough these days to really dive into what the customers are truly experiencing when they land on your website.
A Brief History of Google Analytics
First, it’s important to understand how Google Analytics came to be the analytic giant it is today.
Back in 1995, Jennifer Aniston rocked “The Rachel” haircut, Amazon sold its first book, cell phones were only used to make calls, and a company called Web Depot, a web consulting and hosting business in San Diego, was founded.
According to Attendly, a few years after it was founded, the company’s CEO and technical guru Paul Muret was developing the first version of Urchin, their analytics software when the classic “a-ha” moment struck.
As Paul explained to Attendly, “One of our large clients was struggling with the fact that it took 24 hours to process a single day’s worth of website tracking results. We tried out our new analytics tool, and it took 15 minutes to process the same data.”
“That’s when the light bulb went off – that Urchin was for real,” he added.
Urchin was a hit, to put it mildly. It quickly became the standard analytic software for thousands of websites.
Fast forward to 2004 and a trade show. Google representatives approached the Urchin team and before they knew it, an offer was on the table and negotiations were underway.
By 2005, the software - Urchin on Demand - was acquired by Google, and with that acquisition, Google Analytics was born.
“In a digital agency, web analytics is everyone’s job, whether they realize it or not. You need it for your own insight, but also to help clients to understand their data and how it applies to their businesses.”
This report is likely your first step in creating reports. After all, you want to know if an SEO strategy or PPC campaign is working. Traffic Acquisition will give you a breakdown of your traffic sources and referring sources.
Content Efficiency
You’ll need to be a little more Google Analytic savvy to get this report set up, but it tracks entrances, pageviews, bounces, and goal completions. Click here to learn more from Avinash Kaushik, author of “Web Analytics 2.0.”
Keyword Analysis
Google has been encrypting search data since 2012, which accounts for about 80% of organic keyword data. However, a lot can still be gained by tracking unencrypted keywords.
New vs. Returning Visitors
You probably already know that generating traffic isn’t enough these days. New visitors are important, but it’s also necessary to see what percentage of visitors return to your client’s website. Returning visitors are bae.
Landing Pages
Use this report to see which pages your client’s visitors land on when they first visit the website. If the report shows higher bounce rates on certain web pages, use this information to make these web pages more engaging.
Bounce Rate vs. Exit Rate
Compare the bounce rate (the percentage of visitor who didn’t take action after viewing just one webpage) with the exit rate (the percentage of visitors who browsed 2+ pages on a website before leaving) to isolate UX problems or find pages with lower engagement.
Now, it’s a shock to - well - no one that Google Analytics is an essential of websites of all shapes, sizes, and niches -- but that doesn’t mean it should be the only tool in your digital toolbox.
The Bad: What Google Analytics Won’t Do For You
Google Analytics excels in telling you the beginning and end of a visitor’s journey, but the middle gets a little fuzzy.
Sure, it can tell you how many people visited your website, where they left, and even tell you which campaigns were the most successful.
That’s all useful information, but it doesn’t really explain why visitors do what they do.
Many people use Google Analytics to try to uncover this.
Yes, if one page has a high exit rate, it can be assumed that something is wrong with that page, but what? Once again, you may have isolated the problem page, but there’s still much work to be done.
Was it your call-to-action? Was it your not-so-“mobile-friendly” design? Did you just have a broken link? Were they looking for contact information?
The fact is that you cannot really know for an absolute certain if any of these issues were the ultimate cause of the higher exit rate using Google Analytics.
For example: Let’s say you live in this lovely little abode at 742 Evergreen Terrace in Springfield.
You’re hosting an open house and want to know what people are really doing while there.
So, you put a person at each door to count visitors. By doing this, like Google Analytics, you would know roughly how many people entered the door, how many traveled to a different room, how many went upstairs, etc. It could even tell you your most popular rooms.
Unfortunately, it wouldn’t be able to tell you:
What made your rooms popular;
Which room was accidentally locked and unable to be accessed; or
If visitors avoided the living room because the rug had dog poop on it.
It cannot provide you much context or explanation for why visitors did what they did or specifically what they were doing.
Now, let’s say instead you used a tool like Lucky Orange.
Instead of just having a person at the doors counting visitors coming and going, you would now have security cameras in every room feeding real-time video directly to you.
You’ll see everything - where visitors touched, how many kept trying to open a closed door, and what areas of the living room were the most popular.
Furthermore, if you saw someone struggling to find something (say the bathroom), you would be able to chat with said visitor to know exactly what they were looking for and lead them directly to the right room before they left your house.
Okay, so the world of websites isn’t quite as homey as the Simpsons’ house. It does offer an excellent illustration of why Google Analytics isn’t enough.
For a website - whether your own or your client’s - you need to know more than just the numbers and charts.
It’s about so much more. We’ll talk more about that in a little bit.
The Ugly Missing Link
Look, I have nothing against Google Analytics. There’s a reason it’s a popular tool, but too many brands make the mistake of only using Google Analytics.
For one, it’s not really “free.”
IMPACT’s Iris Hearn broke down Google Analytics’ “freemium” service in an excellent article here. On the free side, Google Analytics is fine for small businesses that don’t want to pay a monthly charge.
However, those wanting more advanced features or the ability to do more should be prepared to pay up (and I mean pay up).
Google Analytics 360 will cost roughly $150,000 annually in licensing.
Ouch.
You get plenty of additional perks such as emergency 24/7 support and technology recommendations, but with a $150,000 price tag, it’s still a tough upsell to swallow.
In a blink-and-you’ll-miss-it sort of benefit to Google Analytics 360, though, is unsampled reporting.
Sampling is exactly what it sounds like - instead of providing a complete data set, the data is aggregated and delivered in a smaller, bite-sized nugget.
It’s not even unique to website analytics. If you’ve ever been called to take part in a research or political poll, you were among a sample size of participants.
For websites, the free version of Google Analytics reports a sample, or percentage of overall traffic, rather than all of the traffic. Let’s say your website had 5 million sessions during a select time period. Instead of showing you 100% of these sessions, Google Analytics shows you 400,000 sessions or 8% of the total.
In this Supermetrics article, Ruben Ugarte discussed one of the most obvious issues of this - you can end up jumping to conclusions.
Yes, sampling gave you the faster response, but you’re still missing 92% of the data needed to make an informed decision.
In a data-driven world, this accuracy matters.
So, that being said, What percentage of sampling is an accurate reflection of the complete dataset?
“I once described the Google Analytics sample rate as akin to my personal confidence in the data. At 90% sample, I’m 90% confident that the data is close to correct. At 50%, I’m 50% confident. At 1% sample, I’m 1% confident.” Sayf wrote. “I don’t generally base opinions on things when I’m as close to a coin flip in regards to my confidence.”
There are workarounds, but it still doesn’t hide the elephant in the room.
“If your business is like IMPACT, however, your job isn’t just to gets clicks. Your job as a marketer is to drive business and you do this by answering the questions of your buyers.”
That’s where Google Analytics fails - it does not and cannot answer all of your buyer’s questions.
It can show you data that can help you guess what your buyers’ questions, but it leaves much open to interpretation.
As good and mighty as Google Analytics may be, it can’t do everything. No matter how hard you try, at some point, you have to go beyond the data.
Light at the End of the Analytic Tunnel
Google Analytics isn’t a necessary evil, but it’s not enough for your website. You need more than just data, especially sampled data.
“The ability to make decisions based on data is powerful. In five years, marketers will be prized for their insight, not their creativity.”
Now it’s time to not only ask what insight you need to grow your website but also how you will get said insight. If Google Analytics isn’t the answer, what is?
The light at the end of this analytic tunnel is simple - conversion optimization tools.
I know “conversion optimization” can seem exotic, expensive, and difficult to use, but really it is just tools such as visitor recordings, live chat, form analytics, and polls (to name a few).
These tools complement Google Analytics data in the best way possible. In many ways, it makes data come alive to answer the questions you have about your website and visitors.
Here are three ways conversion optimization tools, in particular, can make a difference with your website.
1. They Measure interactions
As I mentioned in the Simpson house illustration, Google Analytics really fails at detailing what someone does on your website.
You need to see it in action.
For example, a dynamic heat map can help show you where visitors are clicking. You can see where visitors are clicking in a drop-down or which elements are being ignored.
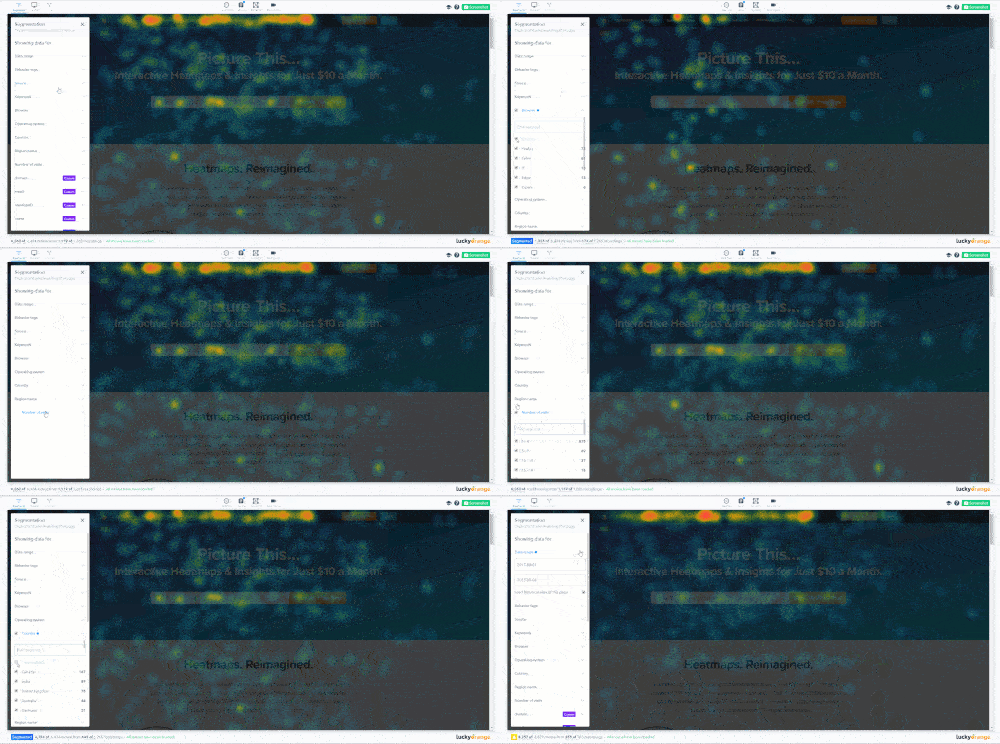
You can also segment the dynamic heat map to show just Facebook traffic or PPC traffic to isolate issues with your campaign or landing page:
As you adjust the “segments” to filter through your data, you can see traffic instantly populate to the filter. You may find that Facebook traffic tends to prefer to stick only above the fold while direct traffic is more likely to scroll to the bottom.
You can then follow up with visitor recordings to see what exactly is going on before and after they clicked on a specific call-to-action.
Pair this insight with a conversion funnel, and all of a sudden you have a new way to look at you or your clients’ visitors and how they are really interacting.
Since nothing is sampled, you get a full look at all interactions and understand where (and why) they left.
2. They Can Connect with Visitors
Google Analytics wouldn’t necessarily be able to tell you which visitor on your client’s website right now is struggling, but tools like Lucky Orange can.
For example, a check of the live visitor recordings would easily let you watch someone interacting right now on your website or on a client’s website.
You could then “ask to chat” to pop up a chat to stop visitors from leaving in real-time by leading them to the right product page or information.
You can also take it a step further by creating a poll that will engage visitors to give their opinion on visitor sentiment, find out what is driving them nuts, identify what visitors are really thinking, and even capture leads.
3. Get Unbiased Feedback
As much as we would like to think that Google Analytics data is absolute, it’s not. We’ve already talked about data sampling, but there’s one other aspect that can hurt websites - biased reporting of Google Analytics data.
Perhaps marketers or designers may misinterpret Google Analytics, other times, it may be that we skew data to meet our own bias expectations. Whatever the reason, ignoring performance issues can only hurt brands by preventing them from understanding what’s working and what’s not.
The answer lies in conversion optimization insight which can’t be manipulated or misinterpreted.
For example, take TaylorMade, one of the leading makers of golf products and accessories. Even though millions of people flock to TaylorMade.com on a monthly basis to get the latest products, tips, and golf news, TaylorMade’s design team struggled.
They were discovering issues too late and becoming reactive. After some deliberation, the team used Lucky Orange dynamic heat maps to see exactly where visitors were clicking on the website before and after designs were implemented.
Clicks don’t lie. Recordings can’t be twisted.
Whether or not changes were effective, dynamic heatmaps and recordings would quickly show what visitors are doing instead.
Maybe it’s not even your changes that went wrong. Was a form field error tripping them up? Maybe they don’t want to be contacted by phone?
Run form analytics to see if there’s something wrong with your forms that could be sending visitors away.
Added bonus: You don’t need to spend $150,000.
Warning: Shameless plug ahead.
If you want to pay $150,000 for Google Analytics 360, by all means, go for it, but there are cheaper methods that can show you more dynamic data - such as Lucky Orange - that start as low as $10 per month.
Not only is it more budget-friendly, but Lucky Orange also integrates with HubSpot. When integrated within HubSpot, recordings, dynamic heat maps, and chat logs are automatically loaded directly for each contact.
And, to put the cherry on top, we also have integrations with Adobe DTM, Magento, Shopify, Unbounce, and a host of other options.
The Bottom Line
Google Analytics belongs in your digital toolbox, but it shouldn’t be the sole tool used on your website or for your clients’ websites.
Conversion optimization insight from tools like Lucky Orange used in conjunction with data tools like Google Analytics can open new doors to improve conversions, impress clients, and make the digital world a better place for all.Featured Image Created Using Placeit.net
Google Analytics offers incredible reporting features at absolutely no cost.
I know Google Analytics isn’t the easiest tool in the world to navigate.
All of the reporting options quickly become overwhelming.
Don’t worry. You don’t need to be an expert to master Google Analytics.
I’m going to share my insights with you on how this stuff works.
I’ll help you become enough of a pro to navigate all of the key features for your content marketing needs.
Our goal here is mastery without the complexity.
First, let’s discuss why you should take the time to learn and use Google Analytics for content marketing.
Why is Google Analytics important for content marketing?
The point of data is to help guide your decisions as a content marketer.
Google has collected a vast amount of data about your business and your customers.
And by signing up for a free Google Analytics account, you can turn that wealth of data into actionable information.
This can show you how your content marketing strategy is performing and which specific areas you can improve.
And it can help you answer some of the following key questions:
Are my current content marketing efforts effective?
What are some quick wins for content marketing that I’ve been missing?
Where are my “leaking pages,” and how can I fix them?
What do my trends look like?
Am I getting better or worse at content marketing?
Which types of content are most effective at building traffic? What about converting customers?
What are some worthwhile content marketing gaps I’ve been missing?
The more data you have, the better equipped you are to make decisions about your overall content marketing strategy as well as your next campaign.
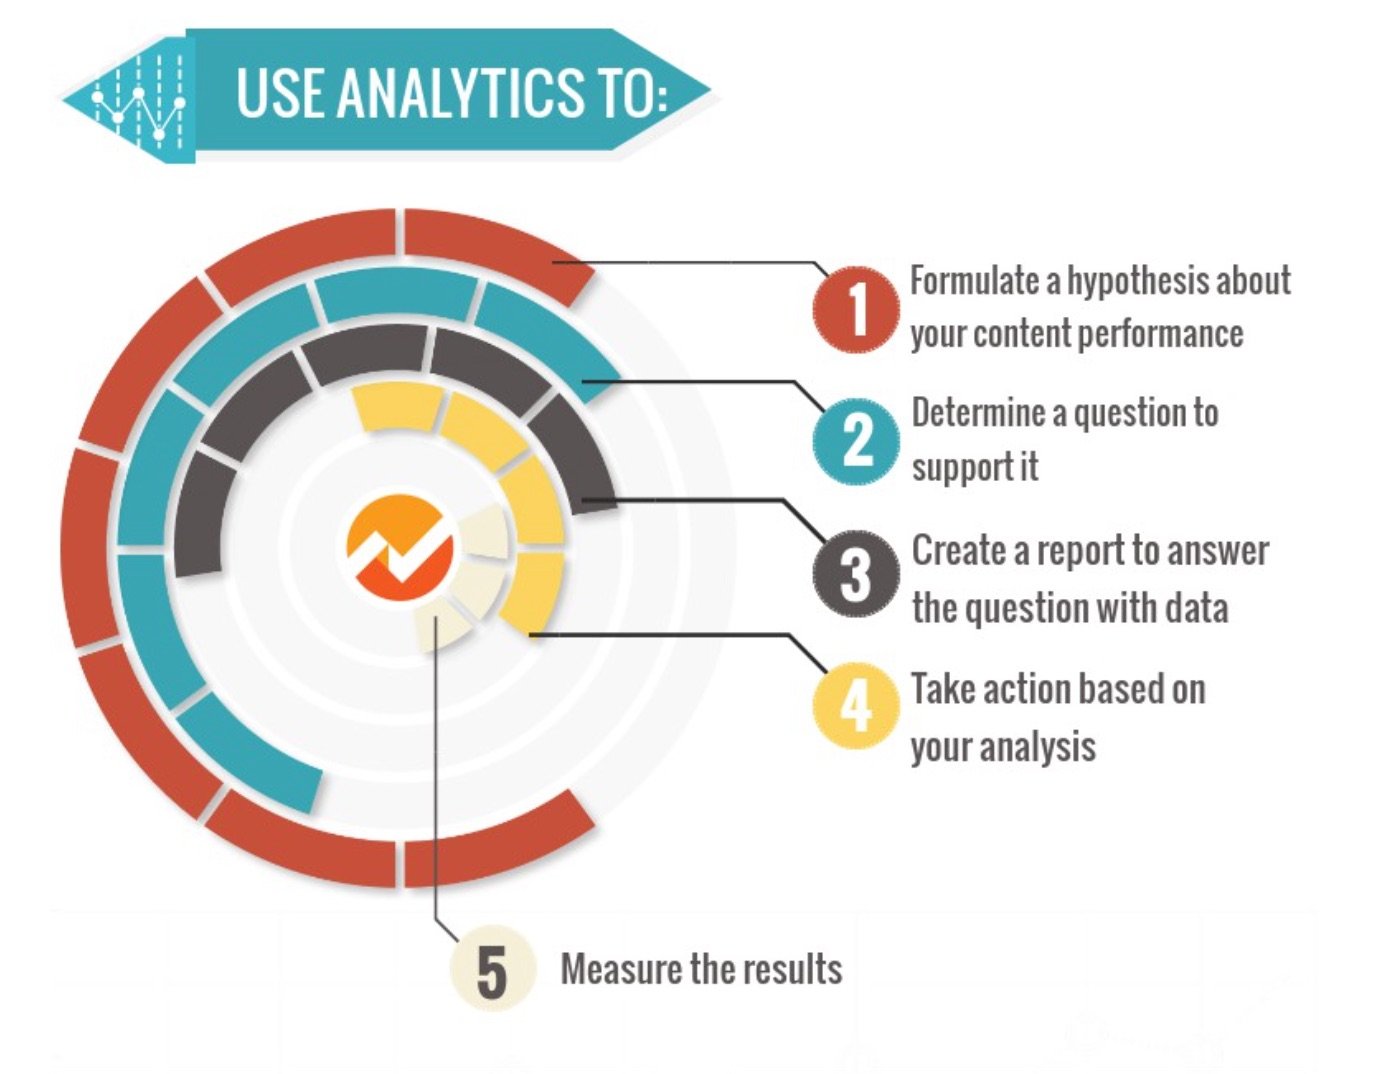
Here’s an example of a solid marketing strategy using Analytics:
You can see how it’s a very methodical approach using reporting and measurements of success.
This means that when you try something new, and it doesn’t work out as planned, it’s much easier to figure out why.
It gets rid of the need for “guess and check.”
You can analyze exactly where your traffic comes from, what your visitors are like, and how they engage with your website.
You can understand exactly how effective your marketing efforts are and if they’re providing a return on investment.
You can also easily pinpoint ways to improve your strategy even when you’re already performing well.
There’s always room for improvement.
So let’s talk about how we take this massive amount of data inside Google Analytics and turn it into valuable, actionable information.
When someone has that much information in front of them, how are they ever going to find what they’re searching for if they didn’t land on it directly from Google?
One of the best ways to help your visitors and keep them on your site is to provide a search bar.
This not only helps your audience but also provides you with valuable data.
With this report, you can easily review which keywords people are searching for on your site.
Then, you can compare this info with the keywords you’ve been targeting.
It’s possible that you have relevant content that you should update to include this new keyword.
Or, maybe you’ll discover a gap in your content.
This will help you find out what additional content you can create to build more engagement and drive more traffic.
After all, you know your target audience is already looking for it.
Another possibility is that you see high traffic to a particular page within your internal search.
You can use that knowledge to do any of the following:
Target those pages with campaigns, especially if they’re also converting well.
Link the high-traffic page to some of your lower-performing pages to boost their traffic.
Restructure your site to make these pages easier to find. For example, you could turn them into featured posts.
How to check for on-site searches
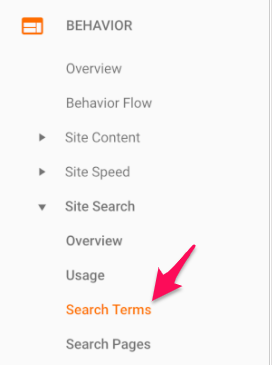
Log into your Google Analytics account. On the left-hand side under “Behavior” reports, go to “Site Search” and then “Search Terms.”
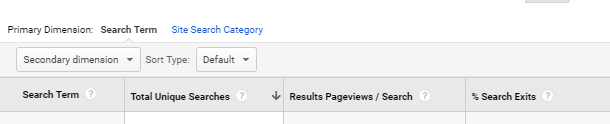
This will bring up a dashboard that shows you all of the search terms that visitors have completed on your site.
It will provide information about the number of unique searches and your exit-rate percentage.
A high exit rate may indicate that the current content coming up for that search term isn’t what users are looking for.
2. Check your mobile strategy
People are using their mobile devices more and more every day.
With that in mind, you should plan for your mobile visitors.
But you can’t just implement without checking to see if it’s working or not.
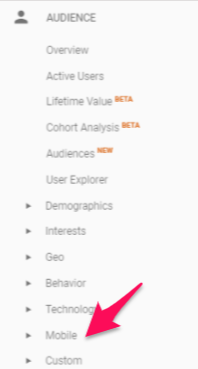
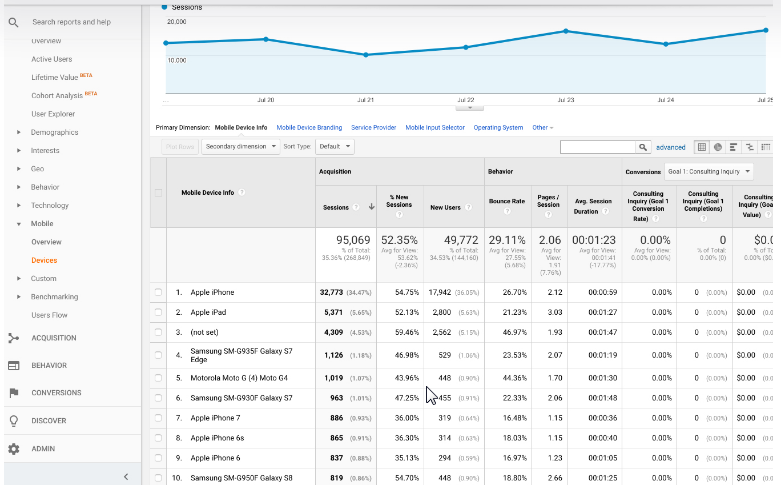
Log into your Google Analytics account and look under the “Audience” section on the left-hand sidebar. Locate the “Mobile” tab.
Expand it and select “Overview.”
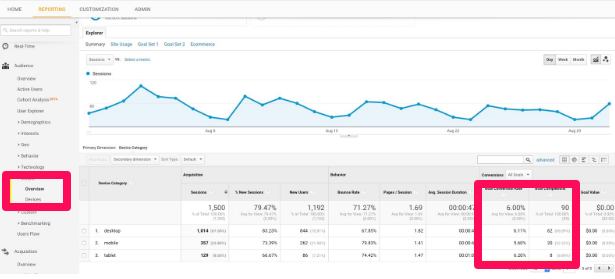
This will allow you to see how your site is performing on mobile devices.
And if you’ve set up a goal that relates to mobile traffic or mobile conversions, you can pull it into this report as well.
On the far right-hand side, select a goal completion for Google Analytics to display next to your mobile performance breakdown.
Then you can see your conversion rates and total goal completions for any given time period.
If the mobile version of your site is performing poorly compared to your desktop version, it could mean that your site isn’t optimized for mobile.
If, on the other hand, it’s simply one operating system or one version of one operating system, the fix will depend on your site development and the OS changes.
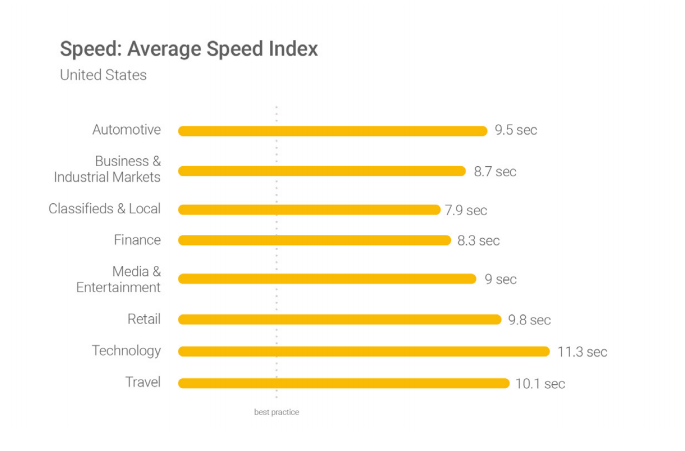
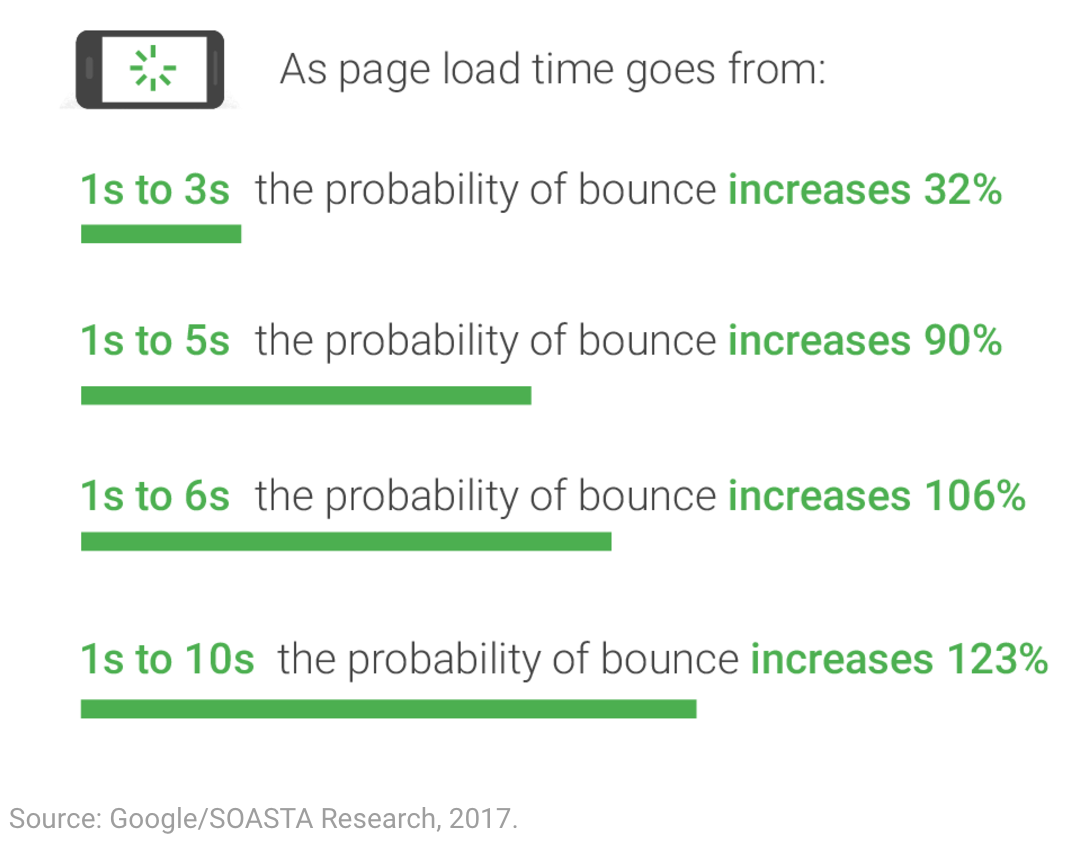
Speed directly impacts your bounce rate, as can be seen in the image above.
Google announced that page speed will be a ranking factor in mobile search as of July 2018.
Having a slow site can kill your chances of ranking in SERPs and tank your traffic.
But before you can try to fix the problem, you first need to be able to diagnose it.
Not every page on your site will take the same time to load.
Using Google Analytics, you can pinpoint the specific pages on your site that need the most improvement.
This way you can save time and gain some quick wins by targeting your slowest, top-performing pages first.
How to monitor page speeds
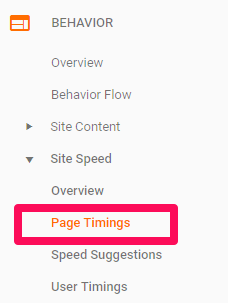
Log into Google Analytics, and under Site Speed, select Page Timings.
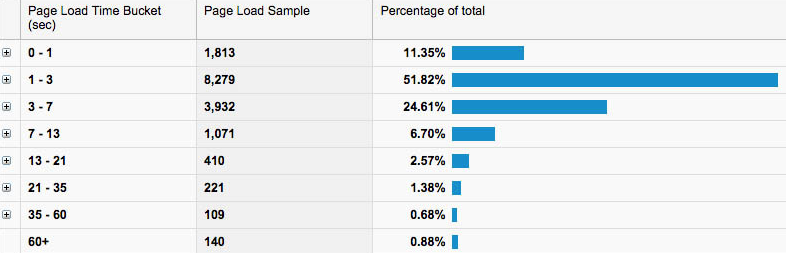
This report quickly shows you all of your pages on-site, grouped by page load time.
You can then analyze to see the specific pages in each bucket.
Want more advice on how to improve slow pages?
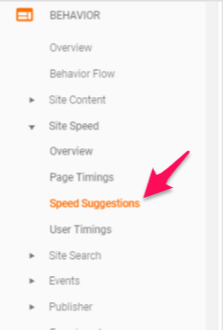
Back in the left-hand menu, also under Site Speed, is a Speed Suggestions report.
This will give you some specific suggestions you can implement to improve your speed.
Google also offers another tool, PageSpeed Insights, for even more free help in optimizing your page speeds.
Well, it’s a great way to increase revenue and profits by tapping directly into your customer’s wants and needs.
You can start to understand your customers better with Google Analytics’ Affinity reports.
How to view your affinity reports
Open Google Analytics and check out your left-hand menu.
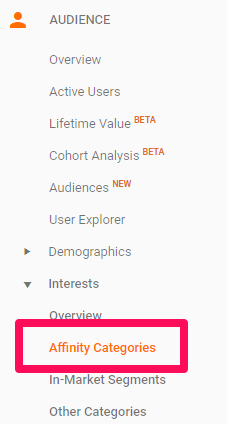
Under the Audience section, you will find the Affinity Categories report.
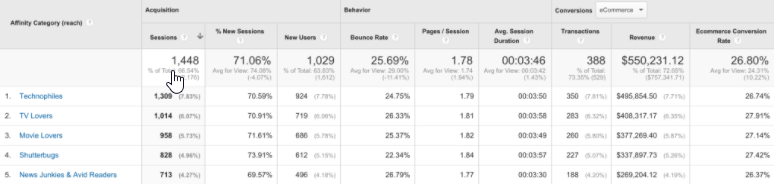
This report helps you analyze common buyer trends.
Check out which affinity groups have high traffic and low bounce rates or high conversions on your site.
You may find that you do really well with a group you never expected to target, such as TV Lovers.
This knowledge can help with future content marketing and ad campaigns.
Another report to help you understand your customer base is the Audience Data report.
How to view audience reports
This time under the Audience section, you’re going to select Overview rather than Affinity.
This is a broad overview.
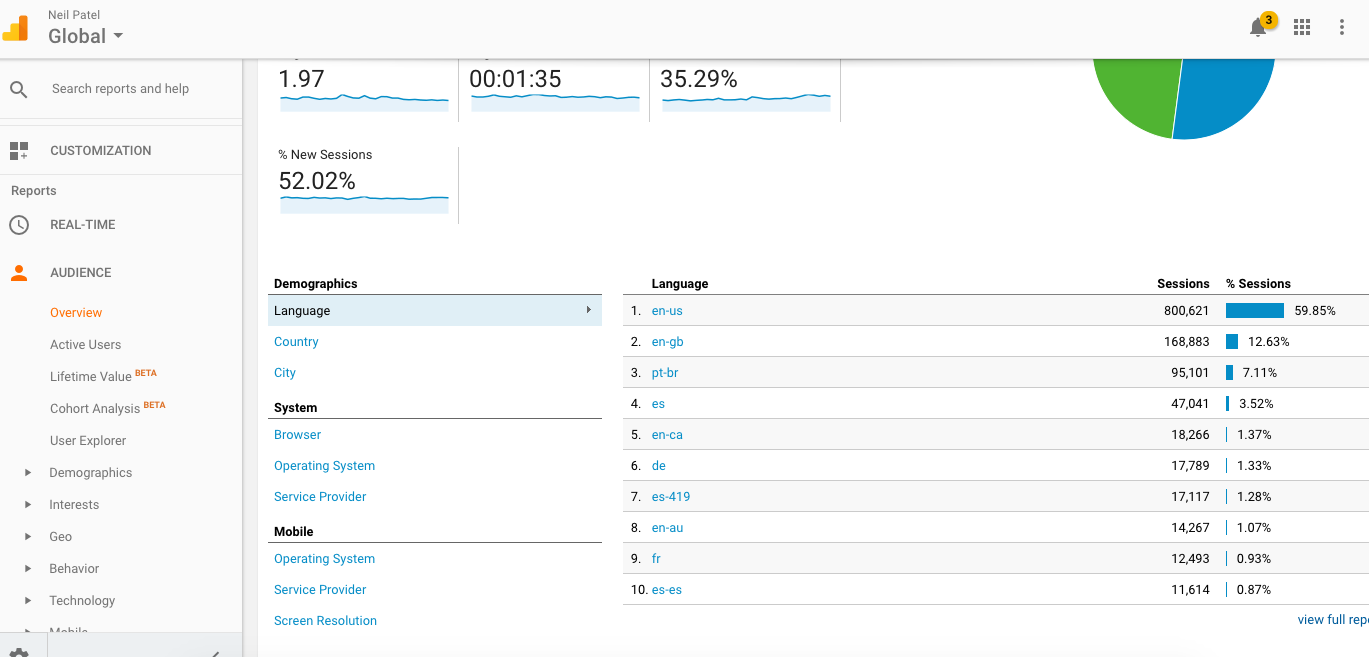
It doesn’t go into a huge amount of depth about your customers, but it helps target some general areas that may be of interest, such as language, device, and location.
If most of your users are from the US, or even from within a few states in the US, that information can be very helpful for marketing.
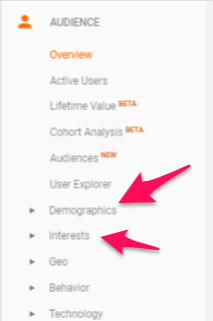
You can further analyze your customers by adding some additional demographic and interest data.
Demographics give you customer information such as age range and gender.
Interests are exactly what they sound like. This report tells you some of the things your customers are generally interested in.
Navigational intent – when a searcher is seeking a specific site such as Facebook or Amazon.
Informational intent – when a searcher is looking for answers or researching a specific topic.
Transactional intent – when a searcher is ready and looking to have a transaction such as “best Chicago pizza near me” or “how to check in for a Southwest flight.”
Of course, this doesn’t cover everything, and people may not also neatly fall into just one category.
However, it’s a great way to start understanding who is coming to your site and why.
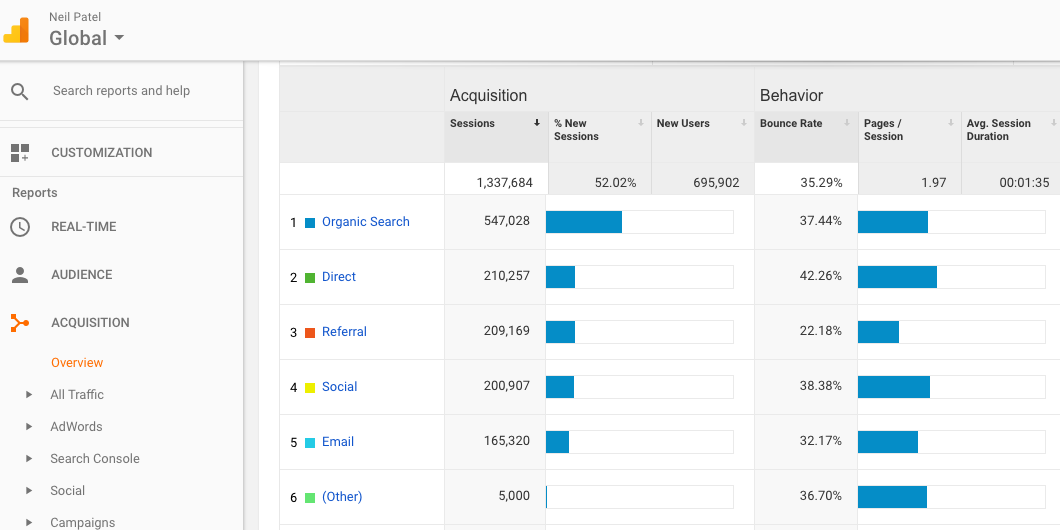
You can begin to understand the intent of your traffic by looking at the Overview of Acquisition report in Google Analytics.
How to check you acquisition overview
In the left-hand menu, under Acquisitions, select Overview.
In this report, you want to focus on organic traffic. The other results could be skewed by promotions and other marketing efforts.
If you click on the word “Organic Search,” it will provide you will additional information:
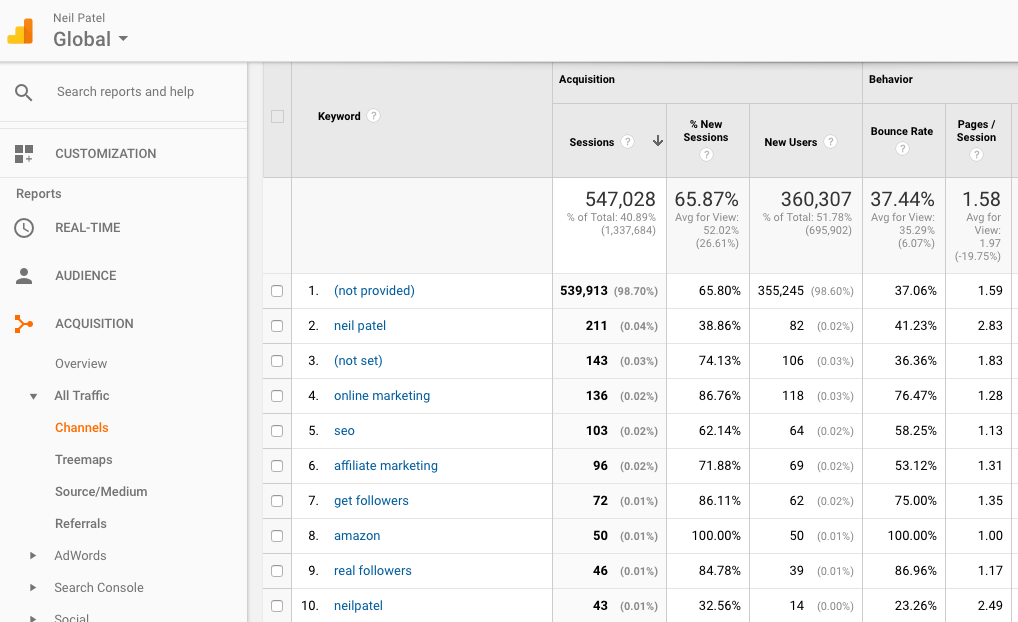
Now you can see a breakdown by keywords searched.
It shows you a vast amount of data, including highest volume, bounce rates, and average pages per session.
You can then use this information in your next content marketing campaign.
For instance, are you receiving a lot of traffic for informational intent searches but not transactional intent?
This could mean you need to boost your conversion efforts and your marketing towards bottom-of-the-funnel searchers.
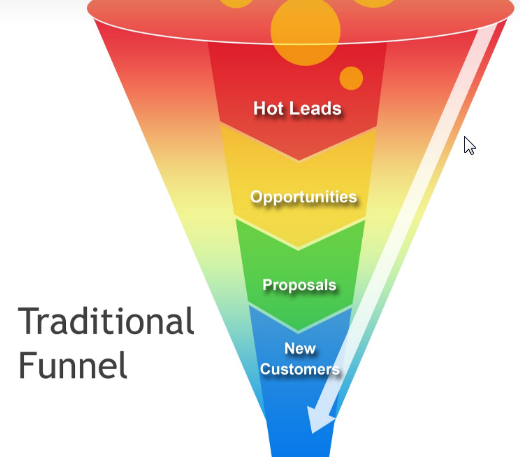
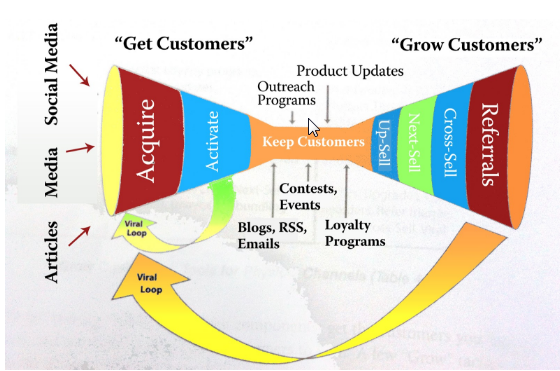
Add in the quirks of individual customers, and the ways users can escape a funnel, and it gets even more complex.
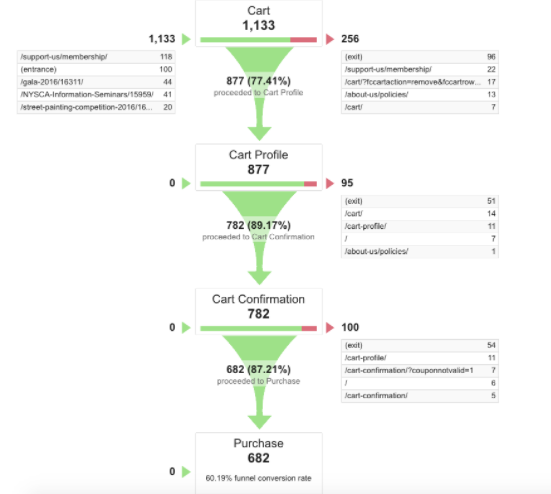
This is why being able to visualize your actual site funnel can help you understand how well your content marketing strategy is working.
It can help you understand which site pages correlate well with each funnel stage. It also helps pinpoint which paths convert well and which ones need work.
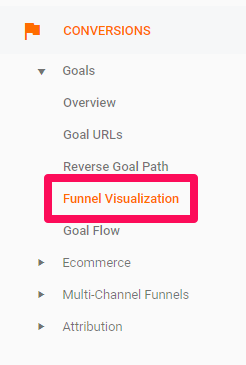
This Funnel Visualization report is in the Conversions section of Google Analytics.
It’s important to note that this report only works if you have already set up some conversion or sales goals in Google Analytics.
How to visualize your funnel
Under conversions, select Goals, and then Funnel Visualization to see the report.
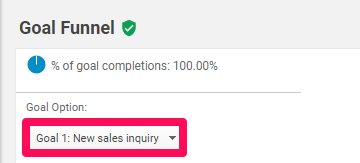
Then select your relevant conversion/sales goal at the top of the table:
Now the report will show you a visual representation of what that sales funnel looks like:
As you can see in the example above, it will show you specific pages that Google Analytics believes line up to each funnel stage based on customer activity.
Another way to look at your funnel is through Sequential Segments.
How to use Sequential Segments
This is a type of advanced segment that can be used for measuring a sequence of user actions.
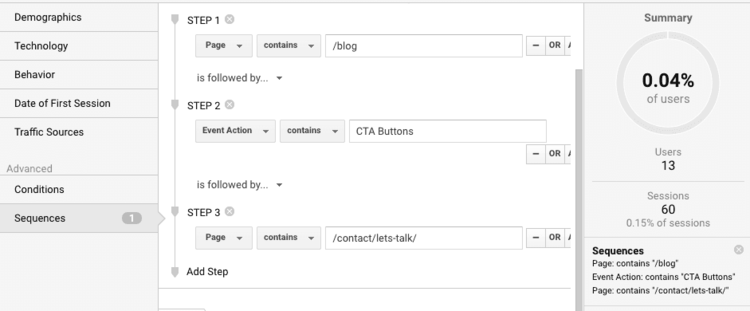
For example, a sequence could be landing on a blog page, clicking a CTA button on it which goes to the contact page, and then submitting the requested opt-in form.
You can create segments to report on just like you create goals to measure against.
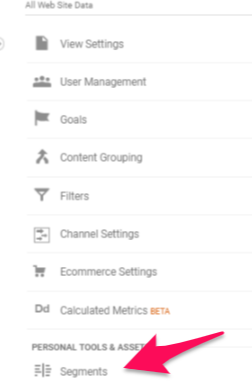
Go to the Admin section:
Then on the far-right, under personal tools, select Segments:
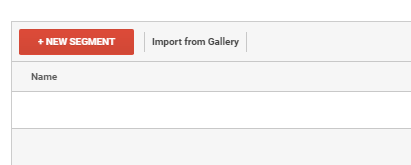
Select New Segment.
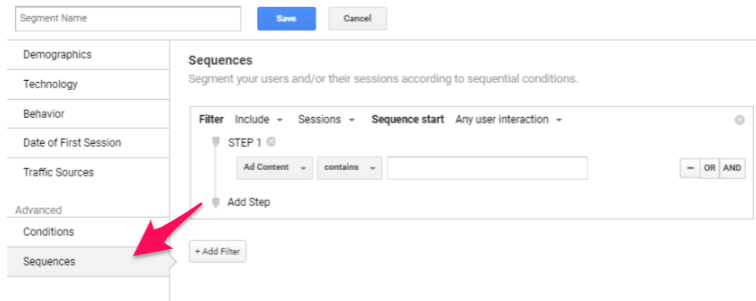
Then choose Sequences under the Advanced options.
Now you create the funnel steps or customer actions that you want to track by inputting the path.
These can be useful to help understand user behavior for different lead pages.
It can also help identify which of your blog posts lead to the most conversions.
7. Focus on your current traffic sources
There are a lot of different possible traffic channels these days.
Search engines, PPC ads, social media, and direct search are just a few.
Where your traffic is coming from may affect how they are engaging with your site and your content.
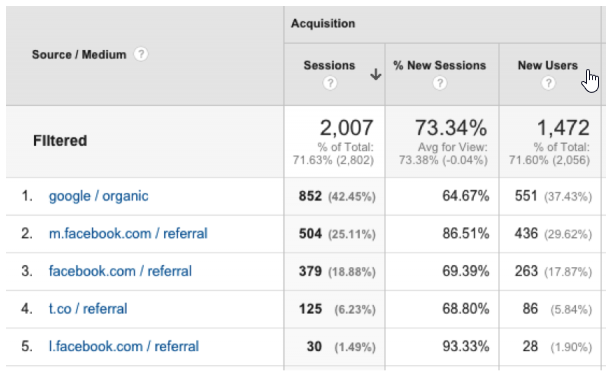
You can use the Google Analytics Source/Medium report to see how many sessions you have by each source.
It can also tell you valuable data like the number of new users and bounce rate.
How to view your traffic by source
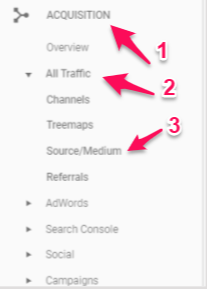
Back to that left-hand menu, under the Acquisition section, go to All traffic and the Source/ Medium.
You’ll see a report showing you a summary of interactions by source.
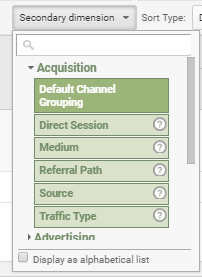
You can also add in secondary dimensions such as Acquisition behavior to make the data more meaningful.
For example, you can see all traffic from Google that was organic only (removing Google PPC ads).
Now you can easily see what referral traffic or traffic types drive visits to specific landing pages.
This helps you target the platforms that are driving the most traffic to your site.
8. Pinpoint high traffic, low engagement pages
High traffic is a good thing, right?
What if you have a ton of traffic coming to your site and then just leaving again?
Is it still good?
Traffic without engagement or conversions is ultimately useless.
Don’t worry though, if you’ve already successfully gained the traffic, then you’ve won half the battle.
Pinpointing those pages which are high traffic, low engagement is a great potential quick win for boosting conversions.
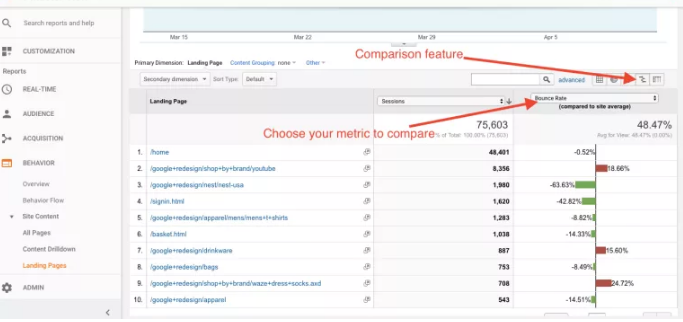
There are a few ways to do this, but one I like to use is the comparison feature in Google Analytics.
How to find high traffic, low conversion pages
Just go to Behavior, then Site Content and Landing Pages on the left-hand menu.
This will bring up all of the pages people land on within your site.
Then you can use the comparison feature on the right-hand side of the screen.
You can select a Goal Conversion Rate if you have one set, or you can choose Bounce Rate from the drop-down menu:
This will allow you to compare conversions or bounces across all pages.
You can easily sort by the ones with the highest number of sessions to find the high traffic, low engagement pages, so you know where to focus your efforts.
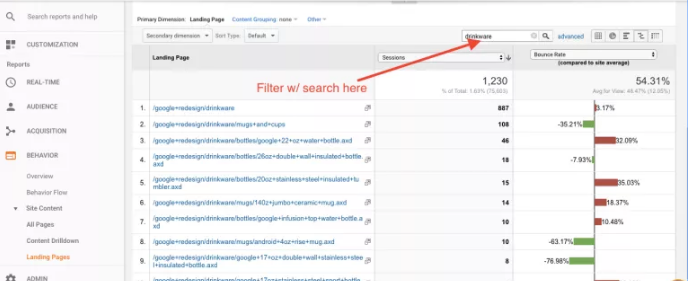
If you want, you can also narrow your results down even further.
For example, you can reduce the search to show only your blog pages.
It’s easy to do this using the search function within the report.
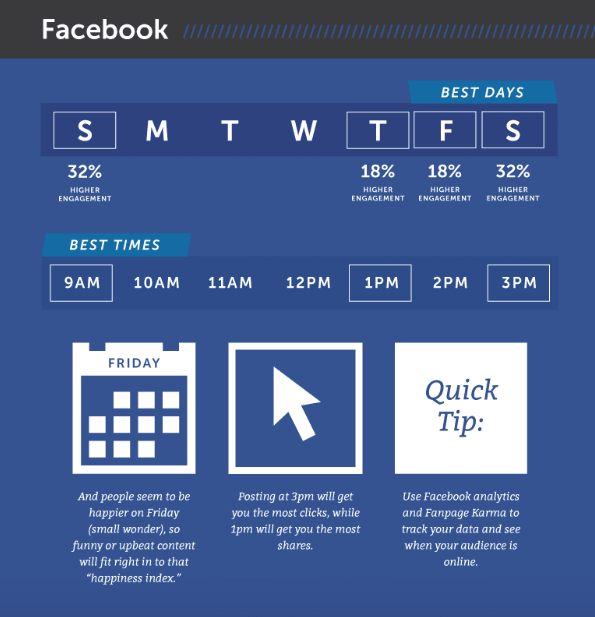
There have been many studies done on when the best day of the week and the best time of day is, across all platforms.
But just because a study says it’s the best time on average, doesn’t necessarily mean it’s the best time for your audience or your business.
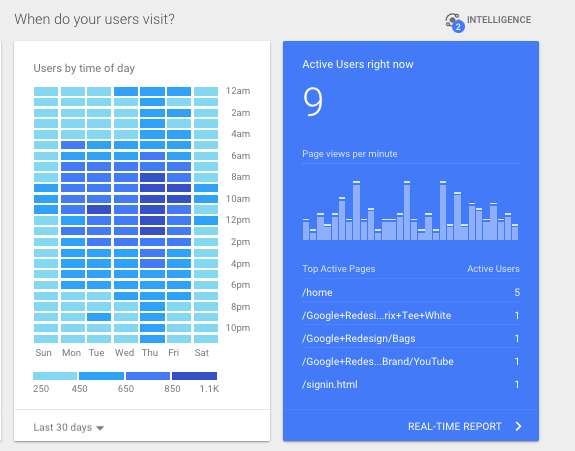
Thankfully, Google Analytics can help answer this.
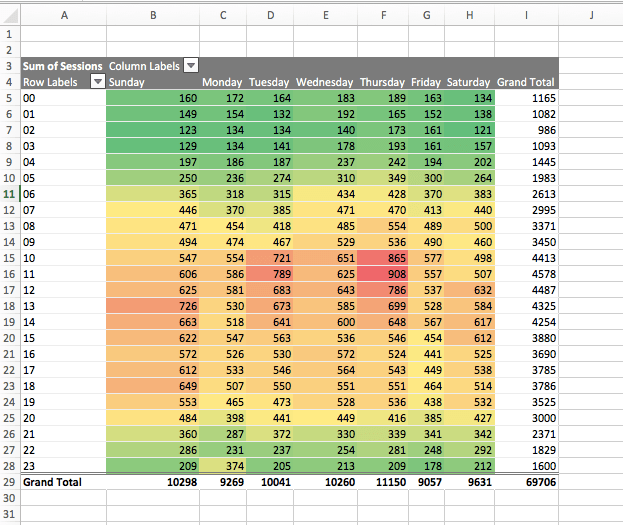
First, they provide a simple heat map right on the homepage for you.
The second option is to use Google Analytics custom reports to create your own. The benefit of this option is that it allows you to customize the variables.
How to set this up
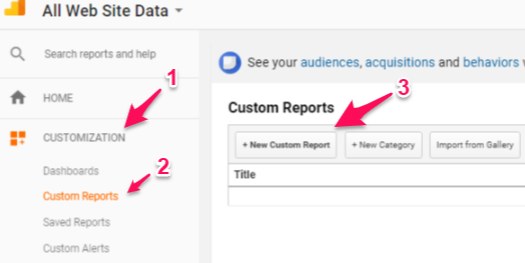
First, go into the custom reports section of Google Analytics and choose a new custom report.
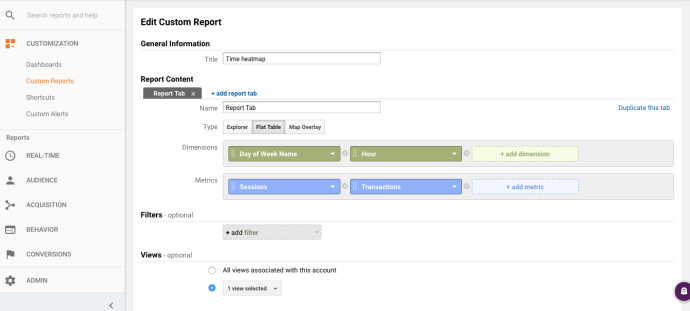
Choose the “flat table” option.
Then add in the dimensions “Day of Week Name” and “Hour,” and then any additional relevant metrics you want.
For example, you might want to include the volume of sessions.
You can also add things like Source/Medium to narrow it down to organic sessions, or Device type if you want to separate mobile from desktop.
Once down, Save and export your data to Excel.
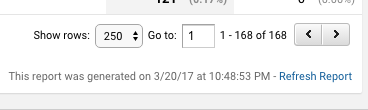
Make sure that you choose “show rows” in the bottom right-hand corner of your screen.
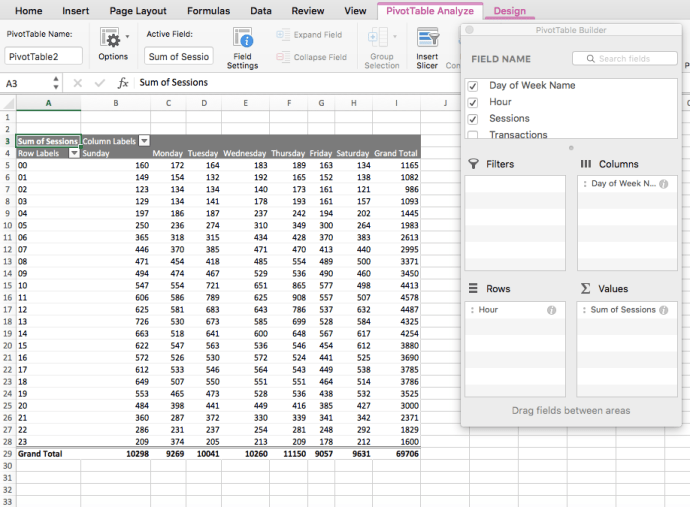
Then, within Excel, you can use the pivot table option to begin to turn the data into a heat map.
Make your columns the Day of the week, your Rows the Hours. Then your Values should be whichever metrics you chose, such as Sessions.
Once you have the pivot table, you can use some conditional color formatting to make it look like a heat map.
This gives you a quick and easy way to see when your visitors are checking out your site.
If you find traffic is heaviest between 10 am and 1 pm on Tuesdays and Thursdays, then you should target publishing your content on those mornings, before 10 am.
10. Track your ROI
I’m guessing that you’re not just doing content marketing for the fun of it.
That means you have a goal in mind. Something you want to get out of your effort.
So how do you know that your content marketing strategy is paying off?
Google Analytics can help you track your ROI.
Remember back at the beginning, when we set up goals?
Now it’s time to use them to help measure your return on investment.
How to measure your ROI
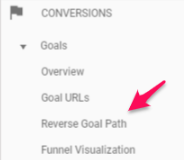
First, you want to check out your reverse goal path.
You may want to add an additional filter such as “/blog” to narrow it down to only blog posts.
Then you can sort by Goal Completions.
Now you can see which blog posts have resulted in the most conversions.
You need to download this data into Excel or as a .CSV file.
Next, download your pageview data to determine your conversion rate.
You can obtain this by going to Content, Site Content, and then All Pages.
If you filtered your Goal, you need to filter this data in the same way.
For instance, filter with “/blog” to get only blog posts.
Again, you need to download the data as a spreadsheet.
Then copy and paste it into a new column in your first spreadsheet.
Now you can get your conversion rate by dividing the data in the “conversions” column (Col B) by the number in the “unique pageviews” column (Col C).
The result is now your conversion rate per page or blog post.
It should look like this:
You can easily see which posts are performing well and which ones aren’t.
This can help you discover which topics are trending or which pages seem to be better optimized for conversions.
Of course, in order to also bring in your ROI, you need to factor in money.
For example, you need to include how much you’ve invested in each post and how much money each conversion has been worth.
Understandably, this is where it gets more complicated.
One way to track conversion dollars is to put tags on your leads based on which posts they came from.
Now, you have full visibility of your content marketing ROI and can understand exactly which posts are worth paying to promote and which ones need to be refreshed or optimized.
Conclusion
Google Analytics holds a crazy amount of data about your website.
Google has done all of the work to gather it and update it constantly. And it’s all there, free for you to use.
It’s important to make use of what Google Analytics offers.
If you don’t measure your content marketing strategy, you will have a very hard time knowing what is and isn’t working.
First, to get full use out of Google Analytics, make sure you take the time to set up some goals for your site so that you can track the things most important to your business.
Then you can use these ten report options for measuring how well your strategy is doing and pinpointing ways to make it even better.
You can use reports such as on-site queries, customer reports, searcher intent, and traffic reports to get to know your customers better.
You can also use reports such as mobile and speed checks, time for publishing, and ROI to understand how to optimize your content strategy.
What’s your favorite Google Analytics report for tracking your content marketing efforts?


 Which domains generate the most links when they pick up a data-driven story?

 What this all means


 Hollis Johnson


 Rick Wilking/Reuters